A very interesting study looked at the growth characteristics of the COVID-19 pandemic in 174 different countries. They found that countries show different growth patterns, as this figure illustrates:
Basically, the authors tried to fit the growth curves to an exponential growth function and a power-law growth function. The difference is that exponential growth just keeps accelerating, while power-law growth will at some point start growing slower. The different colored lines above show how well these two models fit to data from 75 countries. There are some obvious differences, but also clear similarities.
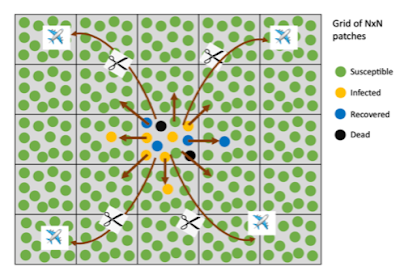
Classical mathematical models for epidemics only explain exponential growth (at least until the effects of herd immunity start to take effect, which was not the case for the countries analyzed). The authors developed the theory that the observed slowdown in growth in the "power law countries" may be a natural effect of separation and limited mixing. Check out this figure from their study:
The idea is that the population is separated into patches (the squares) - think of them as towns or neighborhoods. Within each patch, there's a lot of mixing going on. Between neighboring patches, there is still some mixing, but it is more limited. Mixing to far-away patches requires long distance travel. In later stages of an epidemic, long distance travel is significantly reduced, as indicated by the cut lines in the diagram.
The authors developed a computer model that takes such "metapopulations" into account. If we start with large squares (think big cities), the early growth is exponential - it is easy for the virus to "find" new victims. If we start with many small squares, the limited movement of infected individuals between squares becomes a bottleneck in the spread of the disease, and the epidemic follows power-law growth. Most societies will be a mix of larger and smaller squares. An infection starts in larger squares will grow exponentially at first, but then slow down to a power-law growth.
Now here is why this matters: if an epidemic will slow down from initial exponential growth naturally, we may become vulnerable to what I would call "superstition": if a country implemented measures to stop the epidemic, like social distancing rules, at about the same time, we may come to the incorrect conclusion that the measures work. In reality, this may not be an all-or-nothing thing; rather, we may be prone to overestimate how well measures like social distancing work.
But on the other hand, we can turn things around and use this to our advantage. If we know that limiting mixing between "squares" helps to slow down the spread of the epidemic, then we can use this knowledge when deciding how to slow down the epidemic.
The authors of the study point out a number of possible issues, including the fact that the availability of tests varies widely between countries, and also over time within countries, which complicates comparisons between countries, and can even lead to wrong conclusions within a given country. Other limitations are more technical, and I leave it to you to read the study to learn about them.
But this is very thorough, original, and thought-provoking research that shows another reason why we need better computer models to study the COVID-19 epidemic. Fortunately, this study outlines one way that current models could be improved. Not surprisingly, this is by trying to model the real world more closely, rather than assuming everything happens in a single, homogeneous group.


No comments:
Post a Comment
Note: Only a member of this blog may post a comment.